TradingView indicator · invite-only access
Davidovich Equity Fractal Model Pro+ draws the four-candle model on your chart.
It marks the breached level, the Reclaim, the trigger close that confirms it, the projections, and the price that invalidates the read. One chart and model pair at a time, in the same labels every session.
What FMP+ draws
Four things, in the indicator's own labels.
Everything on the chart is one of these. A monitor panel repeats the same read in plain text, so you can check it at a glance instead of parsing the drawing.
- Anchor · Reclaim · Extend · FinishThe four-candle model
- The Reclaim must breach the Anchor extreme and close back through it at a qualified location. One confirmed reversal owns the map through Finish.
- TriggerConfirmation by body close
- The open of the last opposing run. Dashed while armed, solid after the first body close through it on the chart timeframe.
- -1 · -2 · -2.5 · lvl ✓Projections and open levels
- Standard-deviation targets measured from the reclaim leg, and the prior highs or lows not yet traded through, ticked as price takes them.
- ✗Invalidation
- If price trades back through the breach extreme, the map is removed. A failed read is never redrawn as a winner.
On a real chart
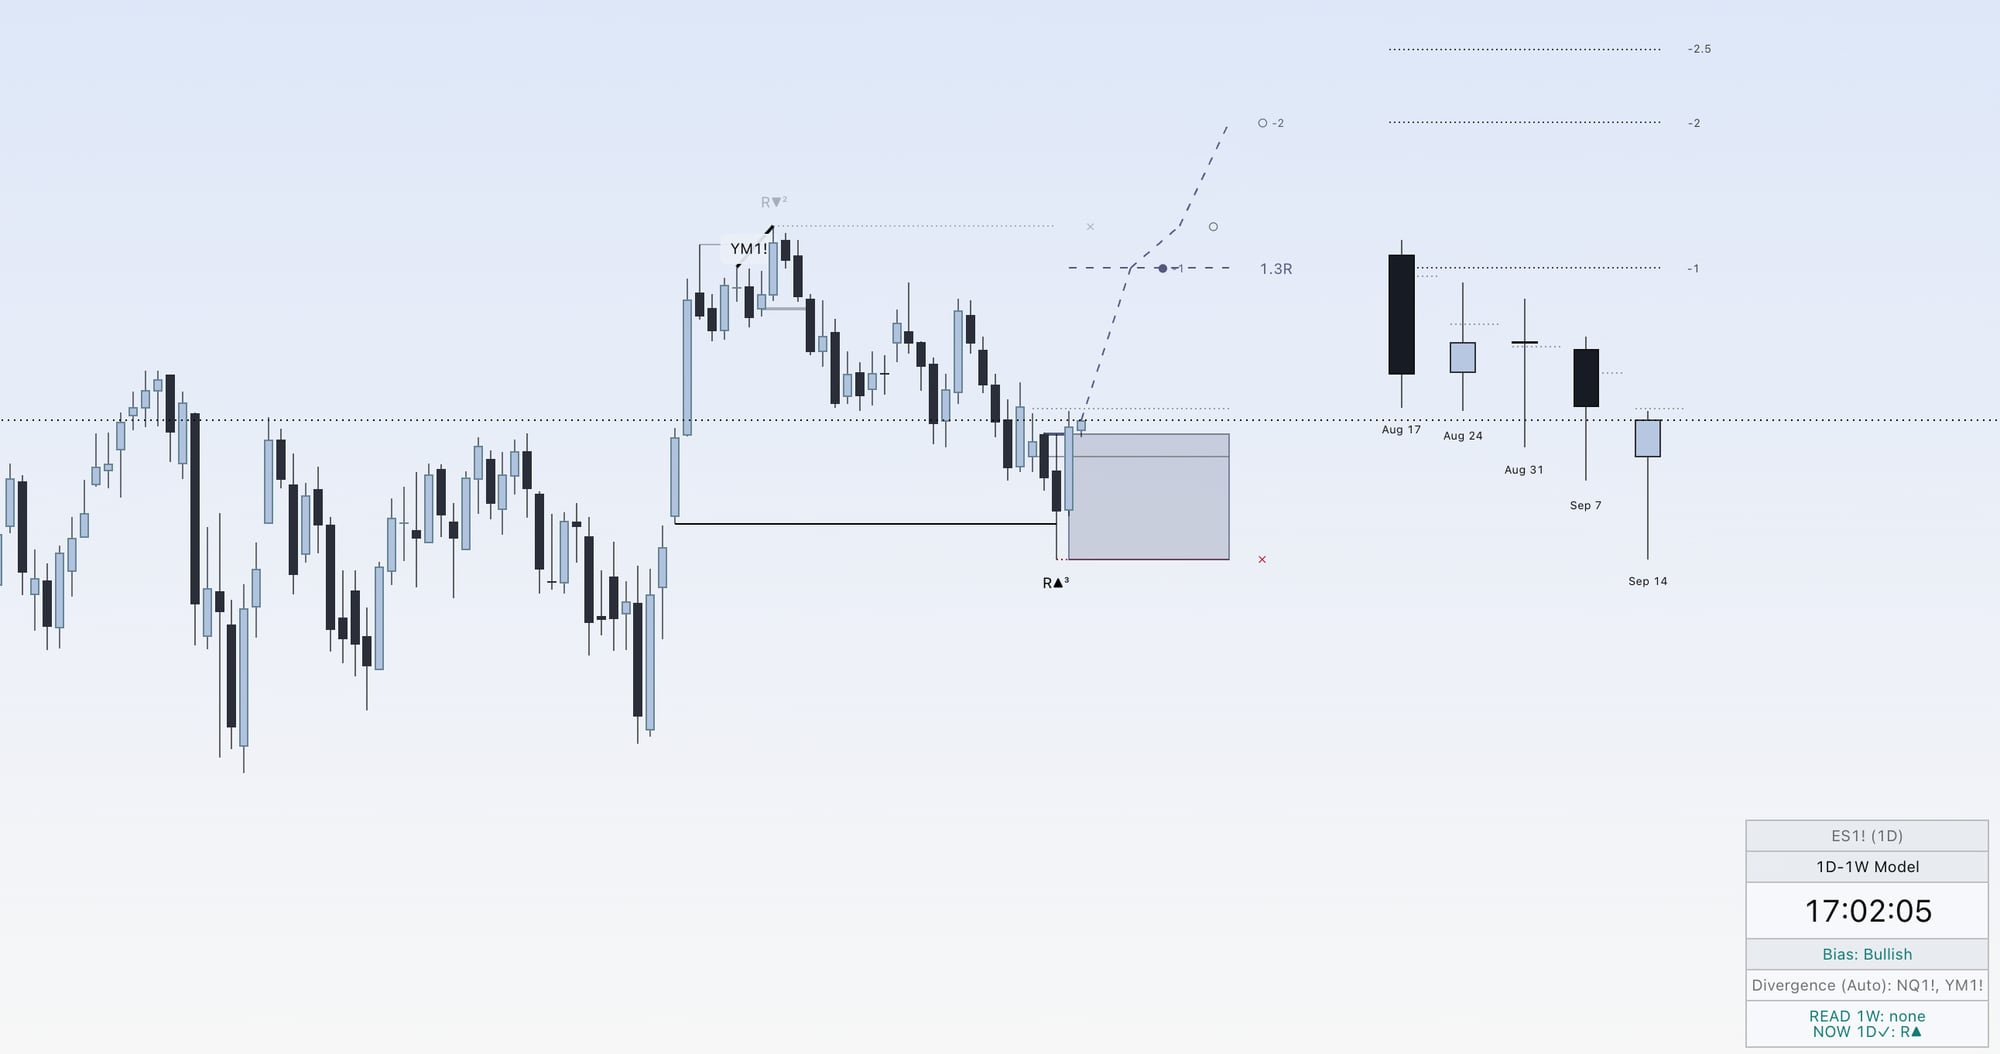
ES, daily chart, weekly model.
A daily candle breached the weekly low and closed back through it at a qualified location, and a later daily close through the trigger line confirmed it: the Reclaim tag carries its three-point score, the reclaim block frames the stop and a 1.3R objective, the expected path runs to the projections, and an earlier bearish read sits above with its invalidation mark. The weekly stack on the right keeps the model candles in view.
Capture from September 2026. An example of the overlay, not a signal or a performance record.
Timeframe pairs
One confirmation chart, one model candle.
FMP+ maps the chart you are on to the model candle it confirms: 15m confirms 4H, 1H confirms 1D. Broader models stay on their own charts and nothing propagates down. An unsupported interval pauses the model and says why.
How the chain worksBefore you pay
Learn the model from the free lessons first.
Six lessons cover the breach, the four-candle sequence, the Reclaim closure, the trigger close that confirms it, the timeframe chain, and follow-through. Read them, then decide whether the software belongs on your chart.
Educational software. FMP+ places no trades, gives no individual advice, and makes no outcome claims.