TradingView indicator · invite-only access
Davidovich Equity Fractal Model Pro+
Draws the four-candle model for the chart and model timeframes: the breach, the Reclaim close, the trigger close on the chart timeframe, the projections, and the point where the read fails.
$49/month or $499/year (saves $89). Once your username is confirmed and checkout succeeds, access is granted within 24 hours.
What it draws
Every overlay element, by its on-chart label.
- Anchor · Reclaim · Extend · FinishStage tags
- Stage labels on the model candles. Ink marks the active stage, amber marks held or superseded history.
- TriggerTrigger line
- The open of the last opposing run. Dashed while armed, solid from the first body close through it on the chart timeframe.
- Wick zoneWick zones
- Bands from the candle open to the prior candle’s midpoint that grow with the developing candle and freeze at period close. The Finish zone needs an Extend that followed through.
- -1 · -2 · -2.5 · -4 · -4.5Standard-deviation projections
- Measured from the reclaim leg with the wick measure and linear spacing by default. Labels tick when reached.
- lvl ✓Open levels
- Prior highs or lows not yet traded through, drawn as a ladder and ticked as price takes them.
- DIVDivergence
- Comparison against related symbols, resolved automatically for CME index futures. Reversal and continuation classes switch separately.
- 1.7RTrade planner
- One plan from the latest qualified stage. The chart shows geometry and the raw R value; the words stay in settings and alerts.
- PARENTParent read
- One state from the next pair up on supported drill-down charts, drawn muted and never owning the chart’s own pair.
- READ · NOW · BiasMonitor
- Ticker, timeframes, model-candle countdown, Bias, PARENT, and DIV. The Detailed layout adds the filter row, the location and score audit, and the READ row.
Alerts: Reclaim · Extend · Divergence · Early forming · Trade planner · Standalone breaches. Light and dark charts are handled automatically.
On a real chart
ES, 1-hour chart, daily model.
After an Extend that followed through, the Finish wick zone is computed from that candle's completed range and the new period open, so it is on the chart before the retrace. The retrace wicked into the zone, a divergence tag printed at the same touch, and the ladder below shows which projections FMP+ had marked reached.
A zone touch is never an entry by itself. The model still needs a fresh paired-timeframe confirmation after the retrace, and a retrace deeper than the zone invalidates the premise.
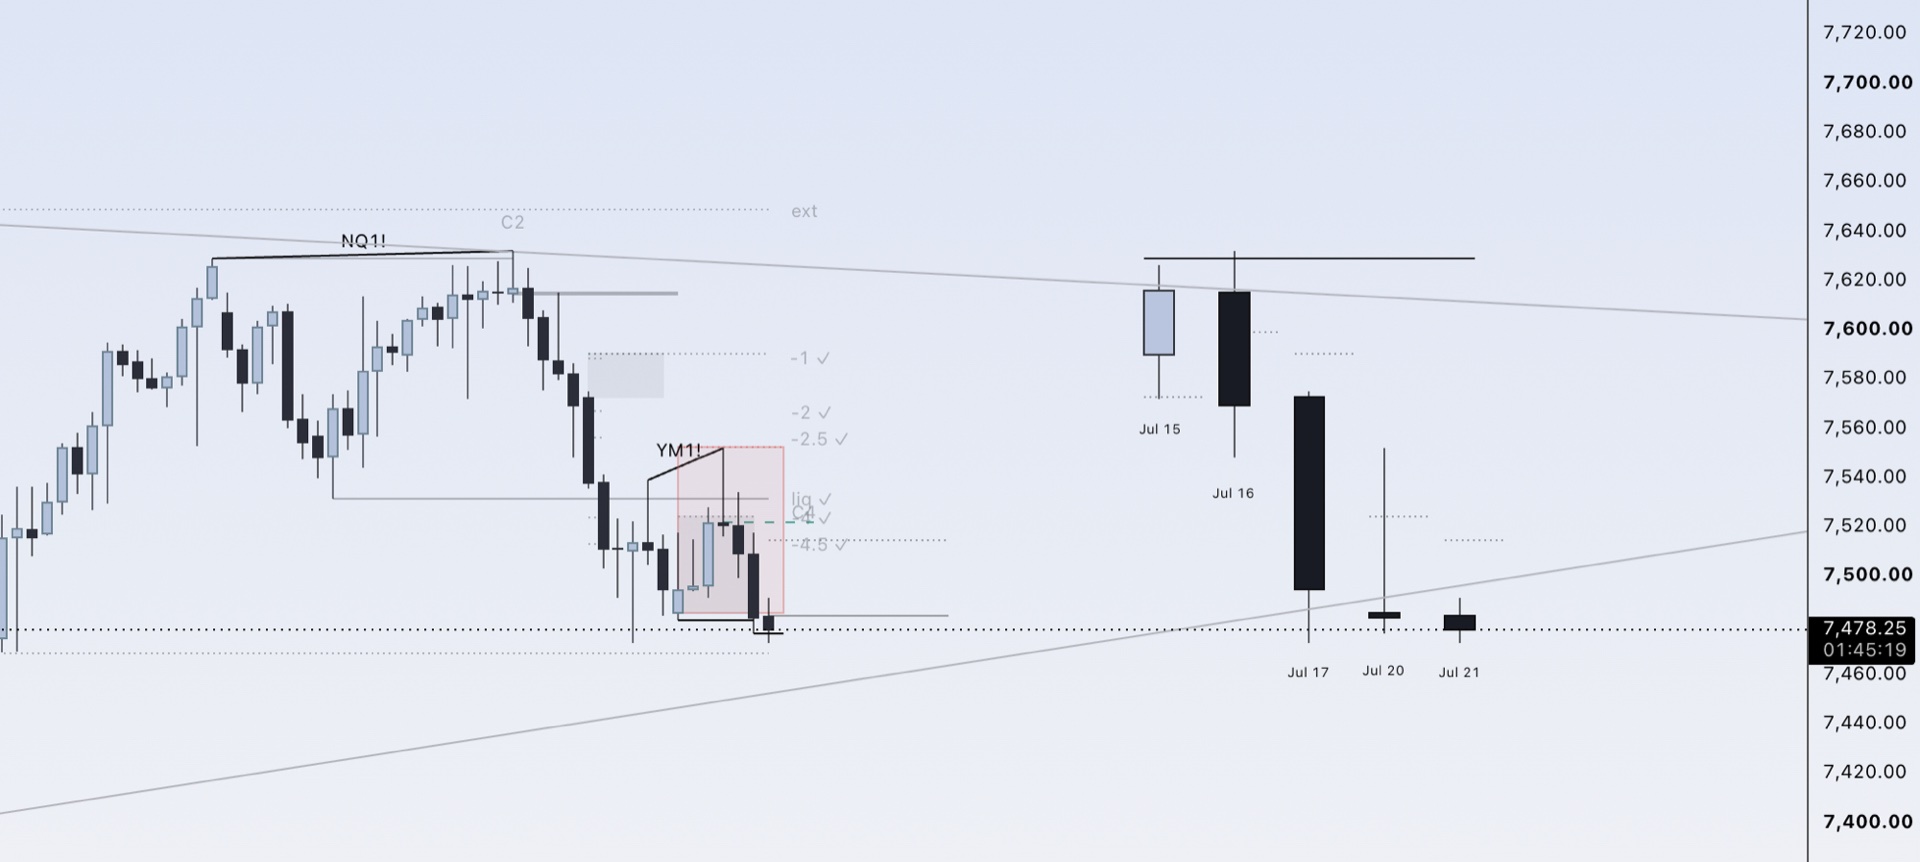
The model
Four candles on the model timeframe.
Validity comes before scoring. A Reclaim or Extend reversal is admitted only when its breach formed at a qualified location, checked in a fixed order: confirmed swing, active gap, the breached reference candle, then the trailing 20-candle range extreme. Require model-timeframe location is on by default.
Anchor
Frame
The reference candle whose high or low holds the level.
Reclaim
Breach and close back
Trades through that level and closes back through it at a qualified location. Closure, not candle color, is the test.
Extend
Confirm and expand
The chart timeframe must body-close through the trigger line first. Extend then continues the move.
Finish
Final stage
An Extend that followed through arms Finish context measured from the midpoint. The model ends at Finish; no later stage is drawn.
Confirmation
A wick is not a close.
The trigger line is the open of the last opposing run on the chart timeframe. The first body close through it confirms the shift and is kept even if the model candle later closes back. With Require trigger close on, breach geometry alone is never admitted as a setup.
Optional trade planner
One plan from the latest qualified stage.
Auto frames the confirmed reclaim block after a location-qualified Reclaim with a trigger close. A qualified Extend selects one gap-first Extension workflow and waits for a fresh confirming closure. The planner never draws simultaneous plans. The chart displays only the setup geometry and raw R value; descriptions stay in settings and alerts.
On · Auto · Default
- AUTO · DEFAULT
- The confirmed reclaim block after a Reclaim, or one Extension workflow after a qualified Extend.
- RECLAIM BLOCK · MANUAL
- Frames the confirmed reclaim block, its retest line, and the structural stop immediately.
- EXTENSION · MANUAL
- Waits for a later qualified location and requires a fresh confirming closure there.
Parent read
One pair owns the chart. One parent is shown for context.
The active chart's own pair alone owns detection, scoring, filtering, and alerts. On supported drill-down charts, the parent read evaluates the next pair up with the same location, trigger, bias, and stage-window admission settings and reports it in the PARENT row. Its optional Reclaim mirror shares the local target settings. The parent read never alerts, scores, changes the settings, or owns the chart's pair. Open the parent chart for its full map.
Supported timeframe pairs
The Reclaim, Extend, and Finish display switches hide drawings only. Detection, ownership, scoring, the monitor, and alert eligibility keep running. A manual model timeframe must be higher than the chart and tile its bars exactly; 1W to 1M uses the calendar-month exception.
What FMP+ handles
- Keeps the breached level, the trigger line, the projections, and the invalidation price on the chart.
- Separates a developing NOW read from the finalized model record.
- Holds one owner per pair so later closes advance Extend and Finish instead of restarting at Reclaim.
What stays with you
- Directional bias, which market to trade, and whether today's read deserves a position.
- Position size, order placement, and how risk is managed after entry.
- FMP+ is decision-support software. It issues no buy or sell signals and promises no outcome.
Questions
About the indicator
What is Fractal Model Pro+?
Fractal Model Pro+ (FMP+) is an invite-only TradingView indicator. It draws the four-candle model for the chart and model timeframes: the Anchor reference, the Reclaim breach and close back at a qualified location, the trigger close on the chart timeframe, Extend and Finish follow-through, standard-deviation projections, and invalidation.
Does FMP+ generate automatic buy and sell signals?
No. FMP+ is a decision-support tool and does not generate automatic buy and sell signals. The trade planner frames geometry and a raw R value; it never places an order. Bias, execution, position size, and risk stay with you.
What activates the trade planner?
It is on by default in Auto. After a location-qualified Reclaim with a trigger close it frames the confirmed reclaim block. A qualified Extend selects one gap-first Extension workflow and waits for a fresh confirming closure. Auto replaces only an unresolved Reclaim plan and clears on stop, target, a newer setup, or disable.
Why does FMP+ pair two timeframes?
The model timeframe supplies the Anchor to Finish structure and the chart timeframe supplies the trigger close. The active chart’s pair owns detection, scoring, and alerts. The parent read shows one state from the next pair up using the same location, trigger, bias, and stage-window admission settings, but it never alerts, scores, changes the settings, or owns the chart’s pair.
Can a live setup change before the model candle closes?
Yes. A NOW read appears after the chart-timeframe close and is removed if price trades back through the breach extreme before the model candle closes. The model-timeframe close finalizes the record.
Which markets can I use it on?
Any symbol TradingView charts. Divergence comparison symbols resolve automatically for CME index futures, including the micros; other pairings can be set manually. Examples on this site use ES.
Billing and access questions are answered on the pricing page.
Put the model on your TradingView chart.
The FMP+ Trader plan is $49/month or $499/year. Create an account, add the TradingView username that should receive access, and check out. Once your username is confirmed and checkout succeeds, access is granted within 24 hours.
Educational software. FMP+ places no trades, gives no individual advice, and makes no outcome claims.