Daily bias: reading the day before you trade it
How to form a working daily bias: mark yesterday's and last week's highs and lows, see which side price has taken, and read the daily candle on a 1H or 4H chart.
This is the fifth lesson in the series. It builds on highs and lows and the D2 Sweep.
Also called directional bias, market bias, or draw on liquidity in other trading material.
What a daily bias is
A daily bias is your working idea of which way price is more likely to work today. You form it before the session from a few levels you can mark on any chart. It is not a forecast. It tells you which setups to look for and which to skip, and you drop it when price gives a reason.
Mark yesterday and last week
Mark the prior day's high and low. Add the prior week's high and low. These are the highs and lows from the first lesson that almost every trader watches, so orders gather just beyond them.
FMP+ can draw these for you. They are the key levels, off by default, labeled PDH, PDL, PWH, and PWL on the chart. Each one reads taken once price trades through it.
Ask which side has been taken
Before the session, ask two questions:
- Which of these levels has price already traded through?
- Which is still untouched?
A level that has been taken has done its job. The untouched level is the next one worth watching. If price took yesterday's low and has not touched yesterday's high, the high is the level to watch. That shows where price may work toward. It does not say price must go there.
Read the daily candle
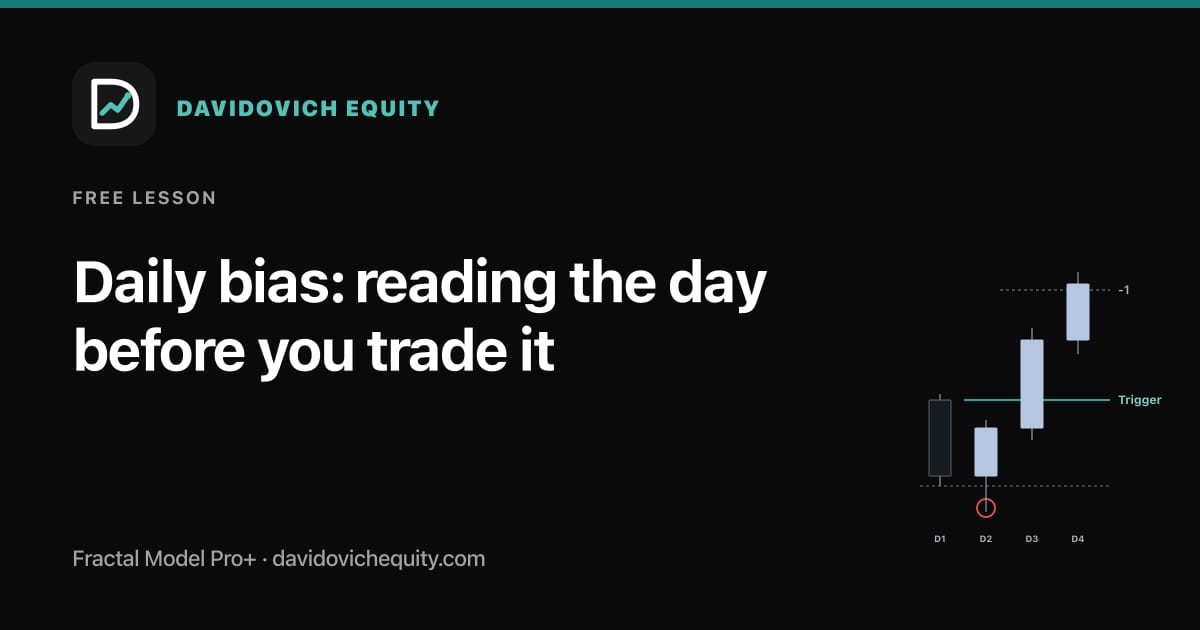
Treat yesterday's daily candle as a D1 Range. Its high and low are the range high and range low. A daily candle can then become a D2 Sweep:
- Bullish lean. Price trades below yesterday's low, then the daily candle closes back inside yesterday's range. The lean is toward yesterday's high.
- Bearish lean. Price trades above yesterday's high, then the candle closes back below it. The lean is toward yesterday's low.
Daily bias
Yesterday's range frames today.
Today trades below yesterday's low, then closes back inside. The next level it may work toward is yesterday's high.
Bias is a working idea, not a prediction. It changes if price closes beyond the swept low instead of back inside.
- Sweep of the prior low
- Close back inside
- Prior day high and low
If yesterday's candle already did this to the day before, today is the D3 Expansion candle, and the lean carries into today. If today's candle is still forming, you do not have the close yet. That is why you watch it on a lower chart.
A sweep with a close back inside is only the geometry. A setup also needs a qualified location and a trigger close, as the D2 Sweep lesson explains.
Watch it on the 1H or 4H chart
On the 1H and 4H charts, FMP+ reads the daily candle as its model candle (the 1H/1D and 4H/1D pairs). The chart timeframe supplies the trigger close. When one chart close carries both the close back inside and the trigger close, FMP+ calls it an early read, before the daily candle has closed. The daily close then confirms it or fails it.
Open the 4H chart to see the daily model. Each chart reads its own pair, so the daily model does not appear on a 15-minute chart. The lesson on multi-timeframe analysis covers this.
The Bias row and trend
The monitor's Bias row shows the direction of the setup drawn on that chart: Bullish, Bearish, or Neutral when nothing is drawn. It does not read other charts, and it is not a forecast.
After a D4 Continuation that followed through, the row keeps the old direction and adds · trend, for example Bias: Bearish · trend. That says the last setup went that way and finished. Its swept level and open targets stay on the chart in gray. Treat it as context about what just happened. It lasts until a setup in the opposite direction installs, a close beyond the old sweep extreme retires it, or it archives after eight model candles.
A worked example
These numbers are illustrative, not a real market.
Yesterday's daily candle ran from a low of 5,000 to a high of 5,100. Last week's high is 5,200. Before the session you mark all three levels. Price has traded through none of them.
Early in the session price trades down to 4,980, under yesterday's low. That level is now taken. A 4H candle closes at 5,020, back inside yesterday's range, and a trigger close prints on the chart. The bias is bullish, working toward 5,100, with 5,200 beyond it. Whether it becomes a setup still depends on a qualified location. The idea is wrong if a later 4H candle closes at 4,970, beyond the swept low instead of back inside.
When the bias is wrong
- A close beyond the swept level. The candle closes past the level instead of back inside. That is a breakout, not a sweep, and the lean is gone.
- A close beyond the sweep extreme. The sweep extreme is the tip of the wick. A chart close at or beyond it withdraws an early read.
- No read yet. Price traded through a level but has not closed back inside. Wait, or stay neutral.
Write down what would prove you wrong before the session starts.
Bias does not place the trade
The order is bias first, then location on the model timeframe, then the trigger close on the chart's own pair. Bias narrows which direction to look. It cannot stand in for a qualified location or a trigger close.
Checklist
- Where are yesterday's and last week's highs and lows?
- Which has price traded through, and which is untouched?
- Did a daily candle sweep a level and close back inside?
- What does the 1H or 4H chart show: an early read, a waiting candidate, or nothing?
- What close would prove the bias wrong?
FAQ
Is a daily bias a prediction?
No. It is a working idea that you change when price closes beyond the swept level.
Do I need FMP+ to form one?
No. You can mark the levels by hand on any candlestick chart. FMP+ draws the key levels and the sweep for you.
What if price took both of yesterday's levels?
Look at last week's high and low. If nothing is clear, a neutral bias is a valid answer.
Is the Bias row the same as the Bias filter setting?
No. The row reports the drawn setup. The Bias filter is a manual setting and stays Neutral by default.
Next lesson: Trade entry
This lesson is education, not financial advice. Trading futures involves substantial risk of loss.
The product behind the lesson
See this on your own chart with Fractal Model Pro+.
Fractal Model Pro+ is the TradingView indicator that marks the sweep, the close back inside, the trigger close, and the D1 to D4 map for your chart and model timeframes, in the same reading order this lesson follows. Access is invite-only and tied to your TradingView username. It is educational software: it places no trades and makes no outcome claims.
Free primer by email
Get the 13-page primer and the next lesson.
The beginner primer arrives right away. After that you get one email per new research lesson, plus Fractal Model Pro+ product updates. Written material only.
Lessons and product updates only. No trade signals, no performance or results claims. Unsubscribe from any email. How we handle your data.